We said to ourselves; “wouldn’t graphs that update every second with live data be useful”, and a few hours later the statd process was tweaked to output 1-second measurements of traffic, CPU, firewall states, etc. and the graph library was modified to dynamically populate data-points (in addition to the “historical” rrdtool file format support that it currently has).
API-wise, this translates into the commandRun API. The normal graphs, populated over time, is fetched using the graphFile API call, which takes an argument such as “interface-em0-packets” and returns the raw rrdtool database data. For real-time graphs, this translates into executing “statd -g interface-em0-packets” using the command-API. While we were at it, we added both “historical” and real-time graphs for firewall states.
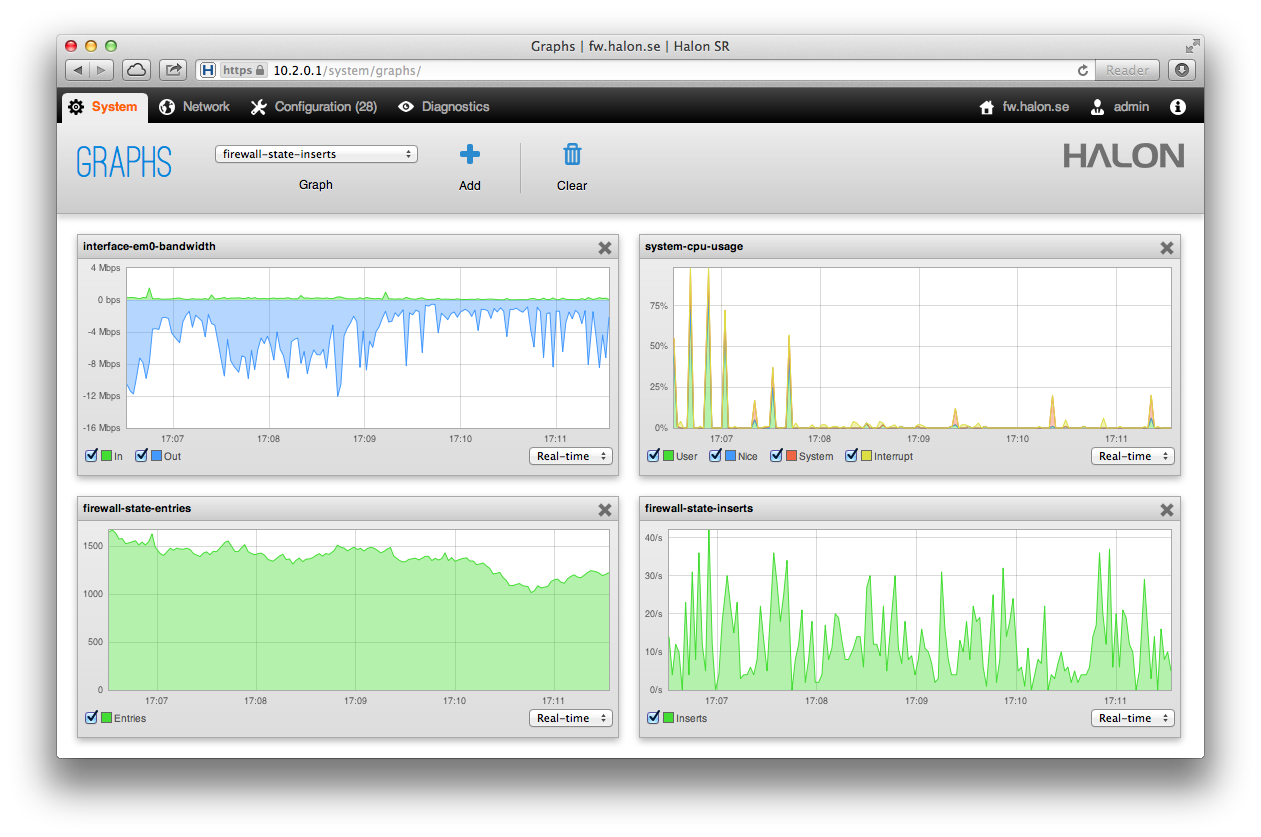
In the web user interface, add graphs as usual, and select “Real-time” as time interval (instead of Recent, Day or whatever it says).