We have some exciting news! The upgrade to FreeBSD 9 and overall refactoring was not the only treatment the Halon MTA got this autumn and winter. We have collected feedback and performed evaluations of how our customers uses the web interfaces, trying to figure out what the best possible reporting and logging experience would be like. Read on to see what this has resulted in.
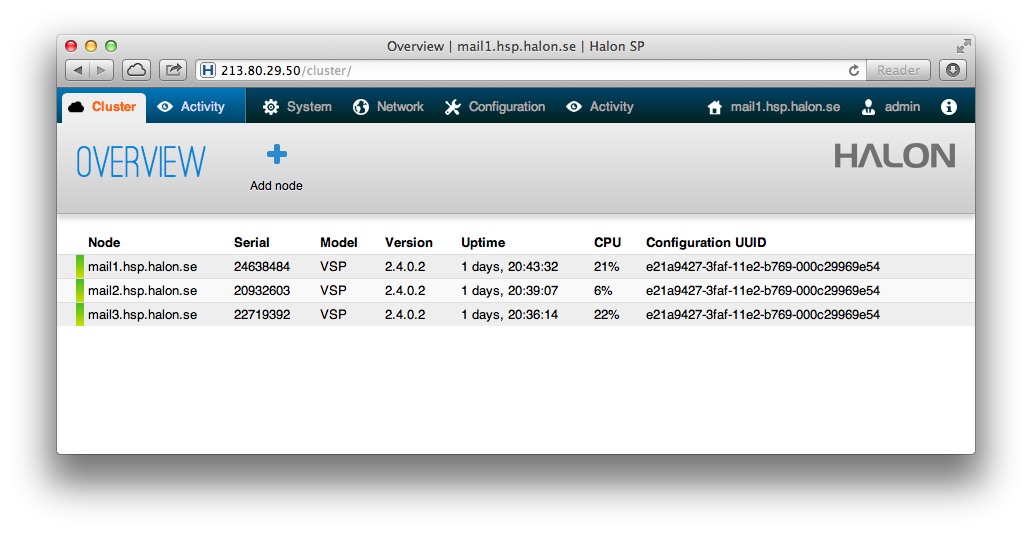
We have migrated to the new web interface from the security router series. That means a prettier UI, faster loading times, the ability to link directly to certain views using URLs with query strings, and better utilisation of your screen’s full width.
Let’s start with the mail tracking. The new UI provides some benefits of its own; displaying more information, auto-scaling all columns, and faster loading. We have combined the history, queue and quarantine within the same page. It’s pageable with a variable page size, so that you can view as many messages as you like per page. It has multi-select actions, for better queue management (viewing perhaps 1000 messages matching a certain search query, and bouncing them all). Finally, the “eye” icon brings up an inspector which you can use to view details for a message by just hovering items in the list.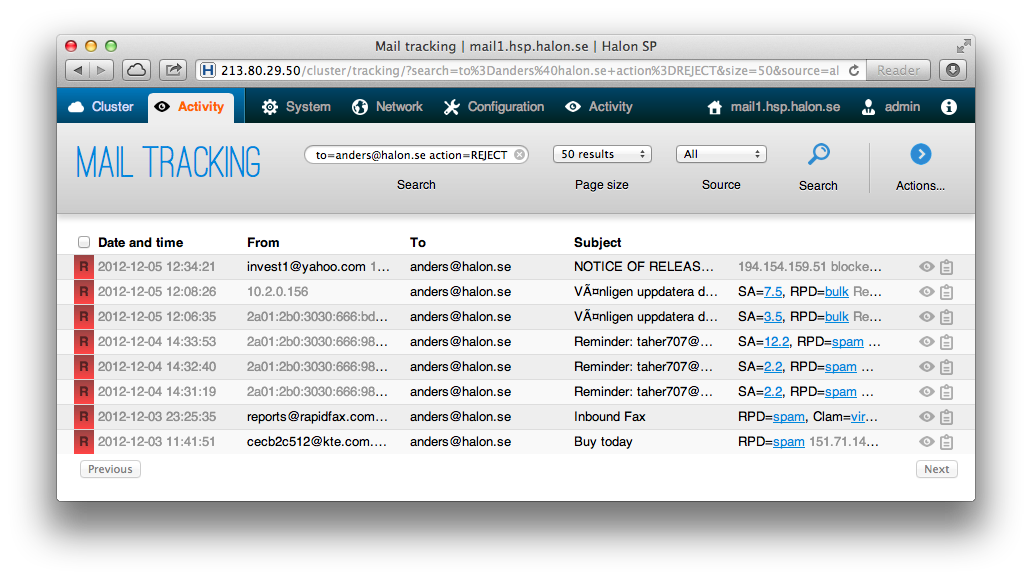
The new log searcher is a lot faster than the previous, and can render thousands of lines without hogging your web browser. Most importantly, it can search multiple cluster nodes at the same time, viewing the number of hits (in real-time) per cluster node as a green badge. In that way, you can start a search for an IP address, and then ask someone to try sending the message again, and you will (when tailing in real-time) see a green badge on the cluster node which received the connection. Extremely handy.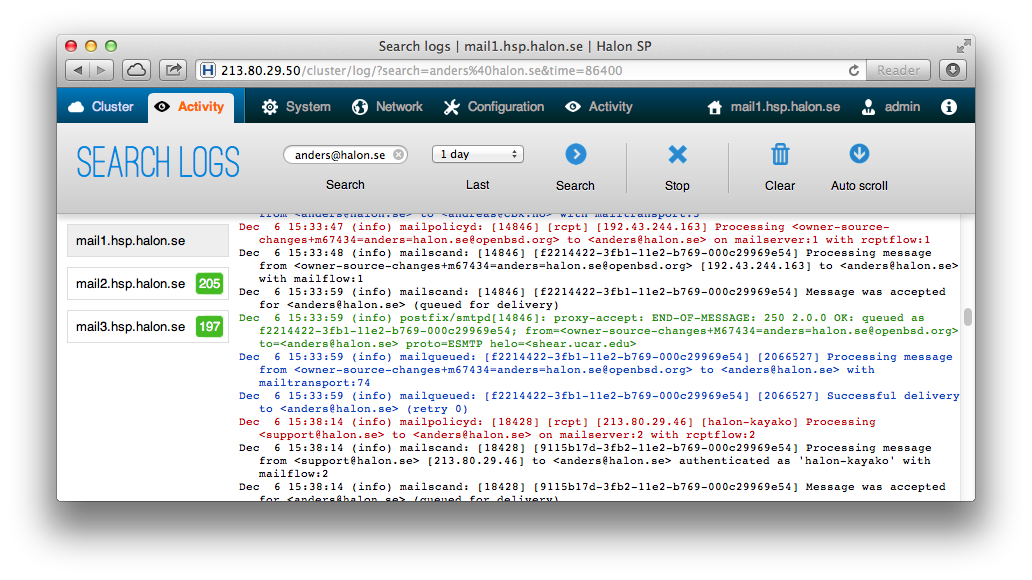
The new reporting and graphs are based on the SR series code. That means a new statd which is fast, produces beautiful graphs, with real-time graphs, customisable legends, etc. Best of all is however that you can graph anything you like. To start with, you can create legends yourself; just look at the pie chart in the bottom right width the edit button clicked. You can even use math expressions to calculate values. Even cooler, you can use the new HSL stat() function in any flow, producing counters for whatever you like. There counters automatically becomes graphs and pie charts. I believe this is the most powerful reporting available in any mail security product ever. Perhaps any appliance.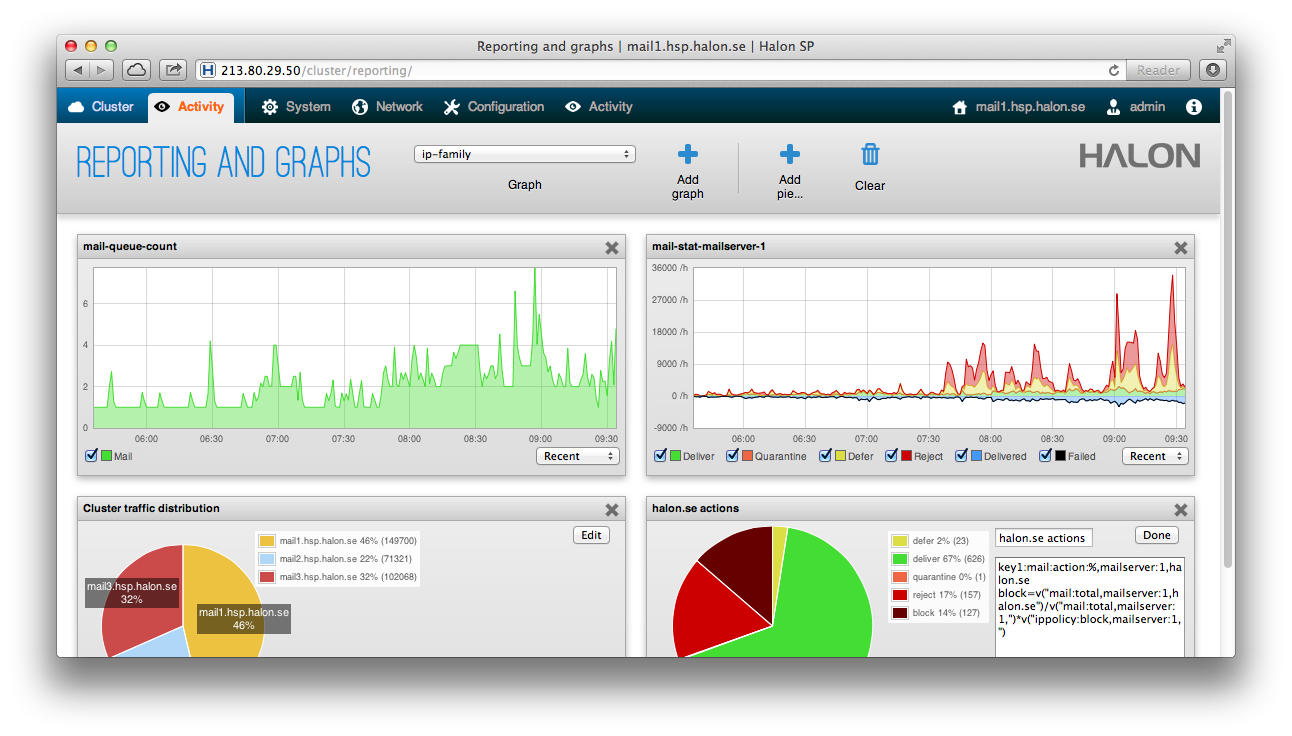
Scripting, such as the system authentication script that allows for remote authentication and custom access levels, has become a lot better thanks to a great scripting editor with syntax highlighting and the ability to test the script using a “sandbox environment”.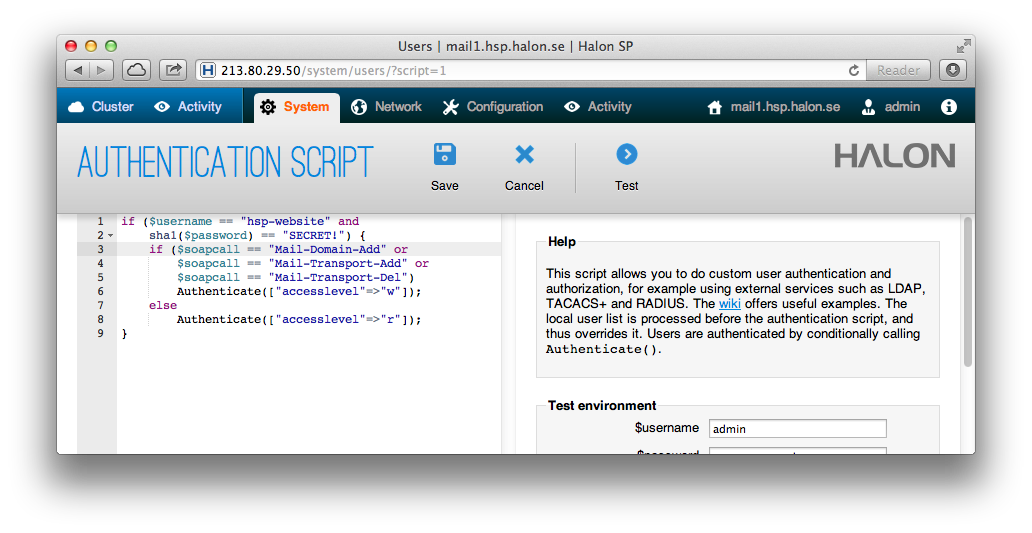
The new web UI from the SR series doesn’t only bring nice real-time graphs, but also a true ANSI terminal.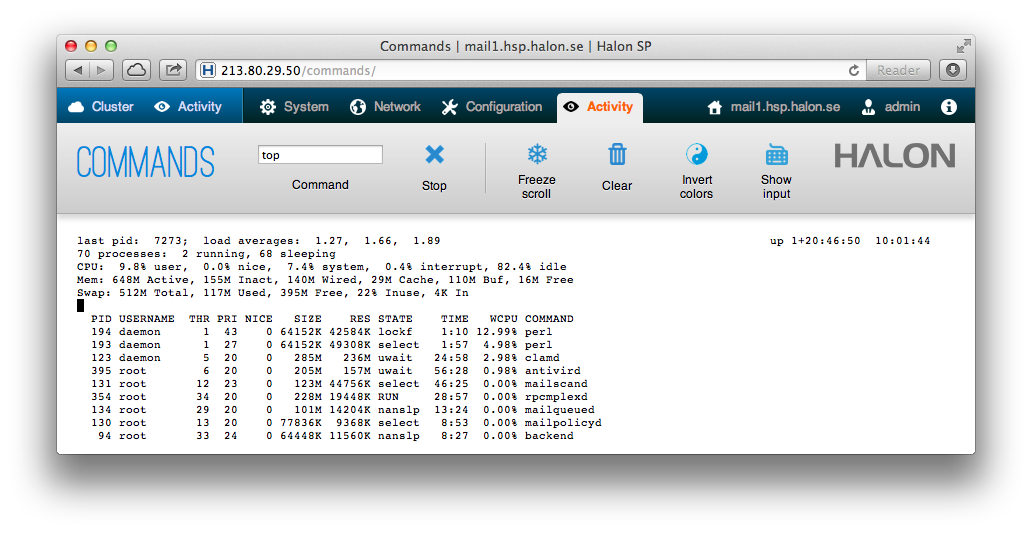
We have made the already awesome clustering a lot easier to configure; with one “create cluster” guide joining two initial units, and one “add node” guide for adding a third, fourth, etc node to an existing cluster.