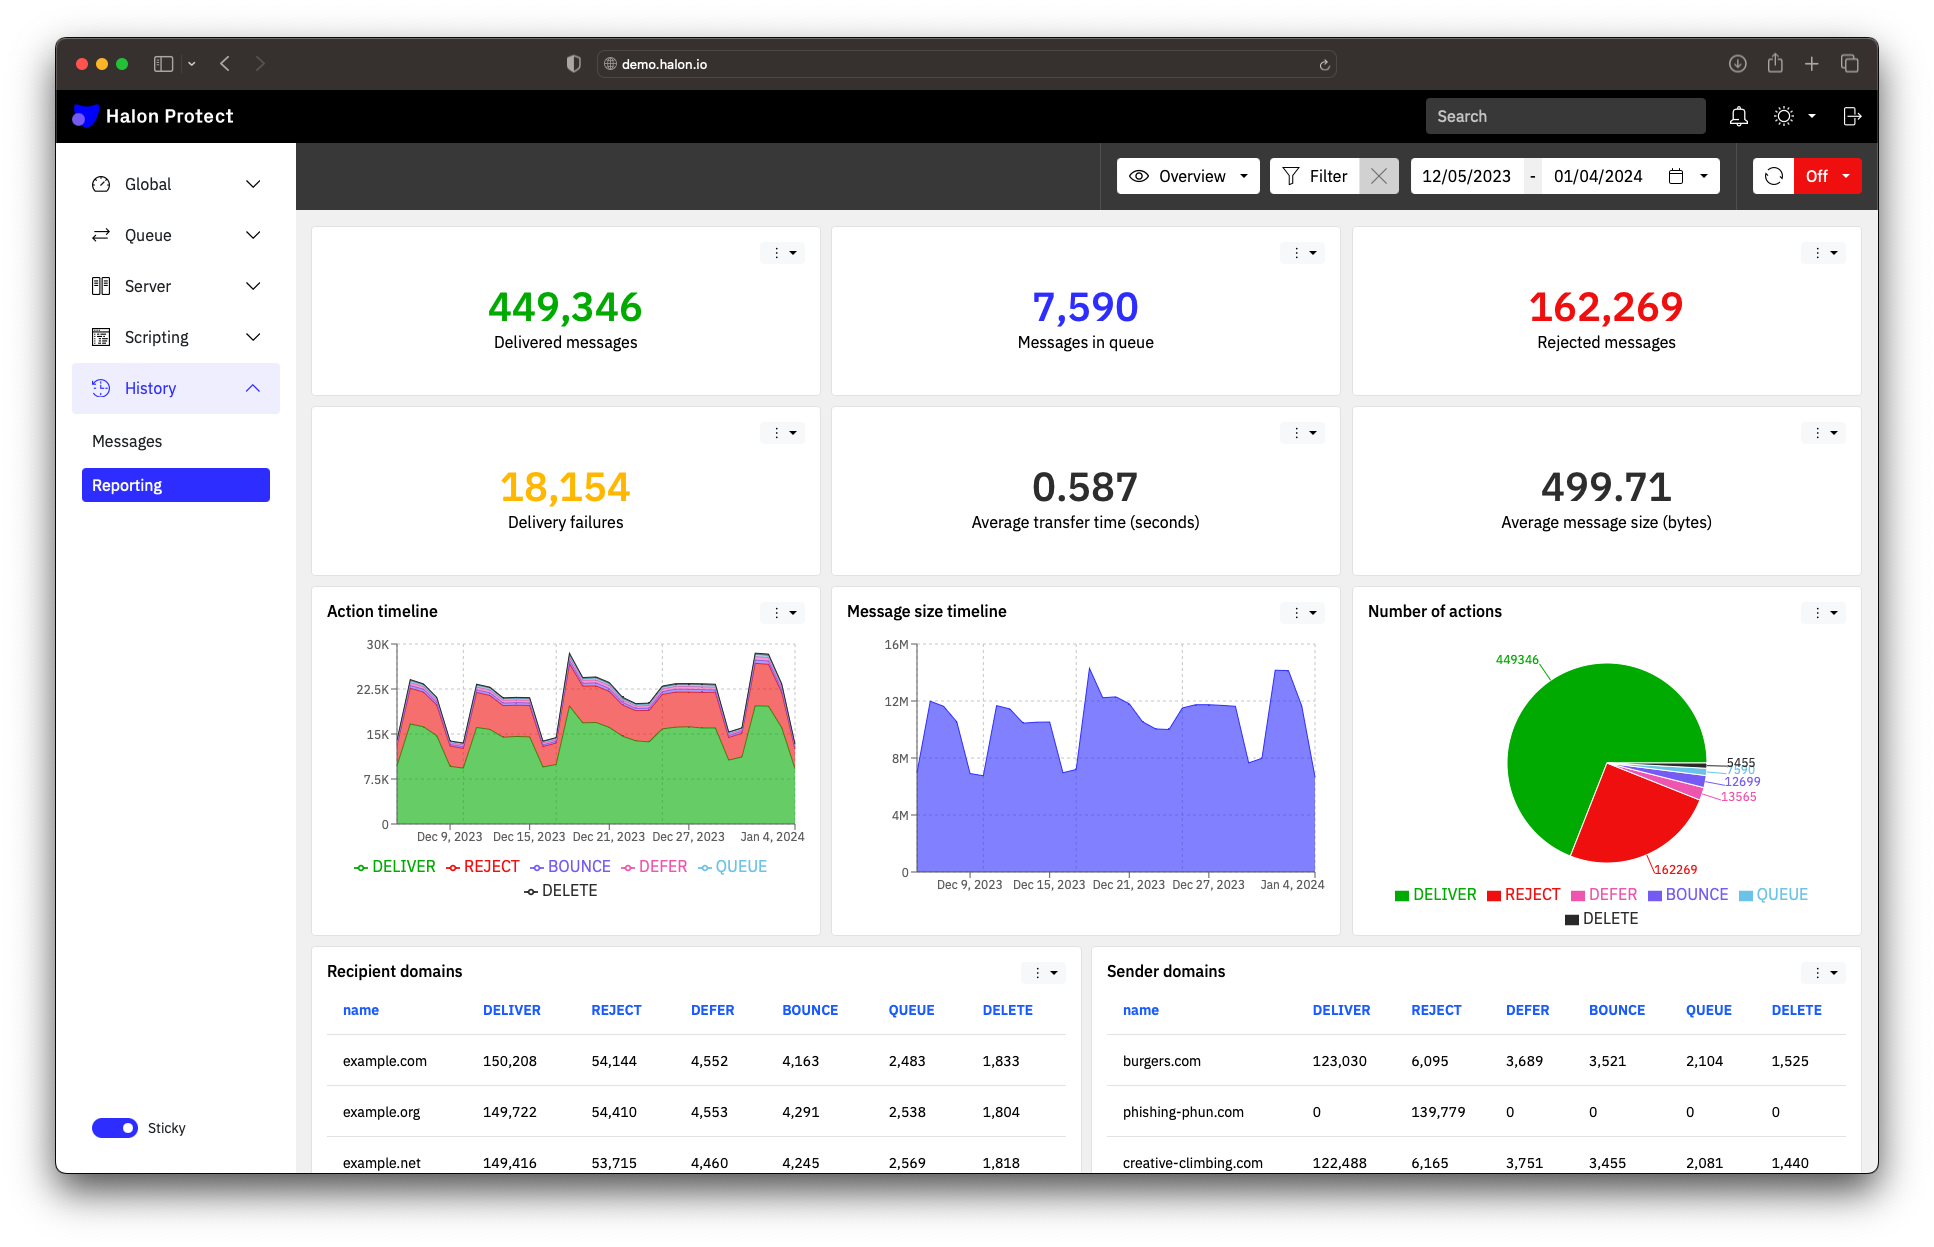
New year, new Halon release! We’re excited to start the year with a bang and launch our latest update - Halon Protect 11. This latest release reflects our unwavering dedication to providing tailored solutions to our clients. Packed with features and enhancements inspired by valuable client feedback, Halon Protect 11 aims to elevate your experience with us.
Key features include:
- Customizable dashboard: Immerse yourself in the ultimate dashboard experience to address your specific needs. Tailor your dashboards to suit your preferences and configure the layout to address specific needs to detect abuse and solve delivery issues.
- Built-in historical logging: Forget about having to toggle back and forth between different user interfaces. Now, you can access both real-time and historical data all in one place.
A dashboard tailored to your needs
Halon Protect's web user interface has reached new heights with enhancements designed around our clients’ needs. The new customizable dashboard allows you to fine-tune, modify, and rearrange components to match your unique needs for detecting, analyzing, and resolving abuse issues. You get an overview of the data that is the most interesting to you allowing for quicker and more efficient operations.
On the queue distribution page, you can create a personalised aggregate view down to each individual counter field which can then be saved as a component added to your dashboard. To effectively visualize the influx of new information on our clients’ dashboards, all tables now feature resizable columns. What’s more, your views can now find a permanent home in a persistent data store.

Built-in historical logging
A significant addition to the web user interface is the incorporation of built-in historical logging. Access both real-time and historical data in one place. Say goodbye to navigating different user interfaces as Halon Protect 11 utilizes ElasticSearch as the backend, while offering more email context-specific controls for data visualization compared to Elastic’s Kibana.
The interactive time series chart allows easy pinpointing of deviations, and with active filters and automatic data reload, monitoring ongoing events becomes a breeze. This streamlined process ensures quicker identification and resolution of email issues.
Additional improvements
In addition to the featured improvements, we've also made many additional enhancements, including:
- The web user interface introduces accounting logs that record all API calls stemming from the administrators’ interactions
- The halonctl queue trace command for troubleshooting outbound connections can now show the time between events with the --elapsed option, and time since the start with --aggregated
- To avoid TCP port exhaustion in very large-scale HAProxy setups, having multiple instance source IP address for connecting to the proxy is now supported
- In case the smtpd processes has to be restarted, startup time with very large email queues (that has to be read back from disk) is now much faster since delivery now happens concurrently with loading
- Several additions to the Halon scripting language; such as the new header_addresslist_compile() function for create a properly formatted Header string of addresses (which together with the improved header_addresslist_extract() allows you to easily modify address headers), mimeword_encode() and decode functions for MIME encoded-word syntax, and a Map merge() method for adding items to arrays or increment numbers.
- New consume-only, spool-in queue directory type, which is only drained and useful during migration of queue folders
- All our projects now include so-called Software Bill of Materials (SBOM) files for our client's software supply chain security workflow.
At Halon, we value your input, and our commitment is to make your experience even more delightful. Explore Halon Protect 11 and usher in the new year with enhanced capabilities and features tailored just for you. If you want to speak to us about this new release, reach out to us directly at support@halon.io.